See status of your hybrid infrastructure at a glance
Overview
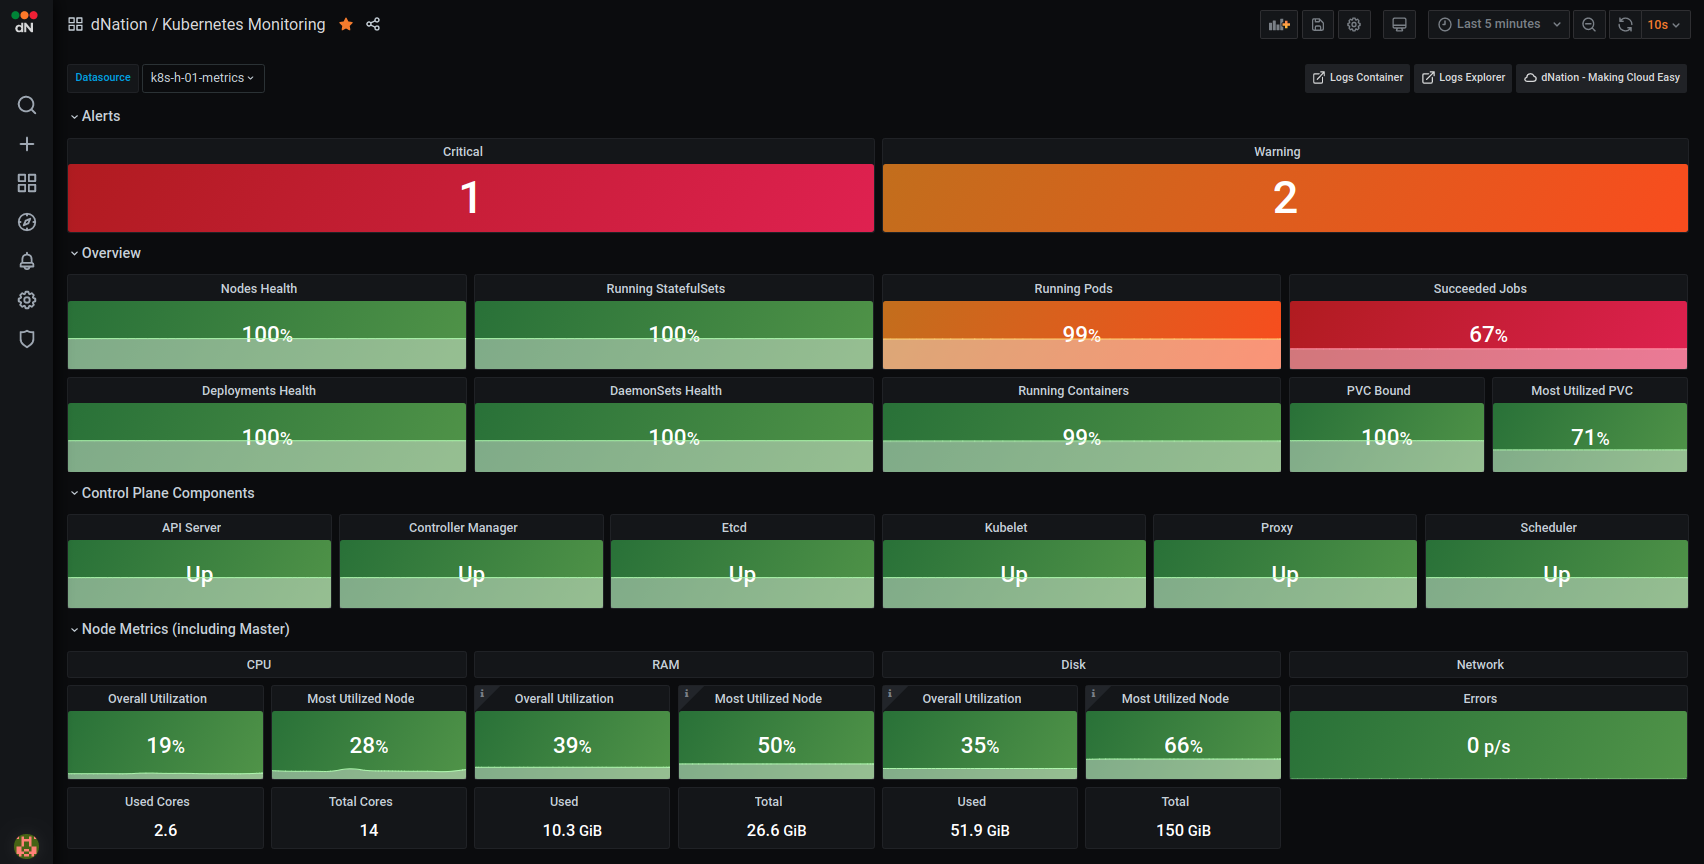
dNation Monitoring allows us to see status of our hybrid (public and private) infrastructure and applications at a glance using semaphore (green/orange/red) principle:
Green – All is fine, I can go to lunch
Orange – Something is wrong, but it’s not urgent, I can go to lunch but have to have a look afterwards
Red – something is seriously wrong, I can’t go to lunch right now
Basic design principles:
Intuitive – Green, orange and red colors signaling whether or not your action is needed
Drill – down – if you want details why something is green, orange or red, just click it
Relevant information only – provide only metrics relevant for this particular area of interest and drill-down level, side-by-side with logs (experimental feature)
Monitoring targets
Kubernetes cluster
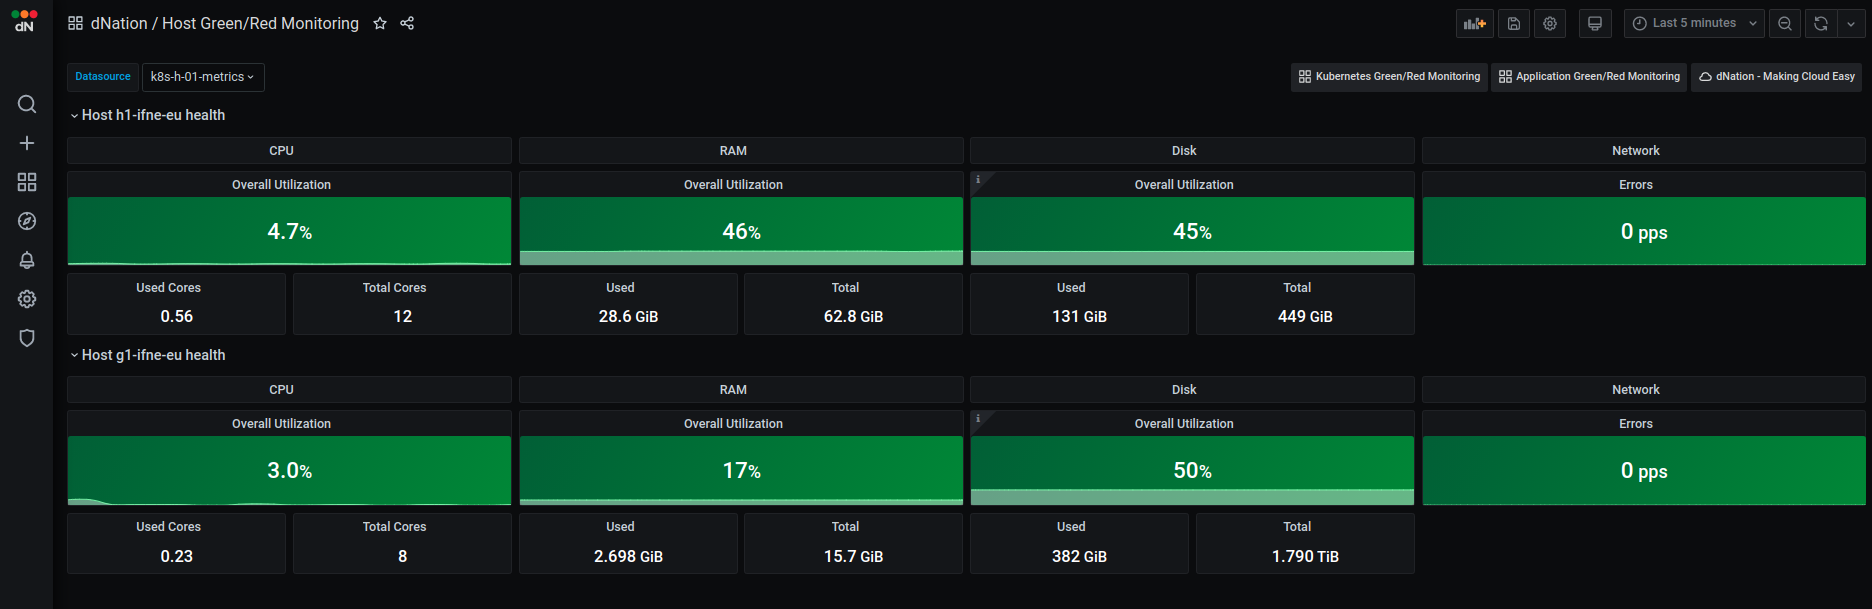
Hosts (physical/VM)
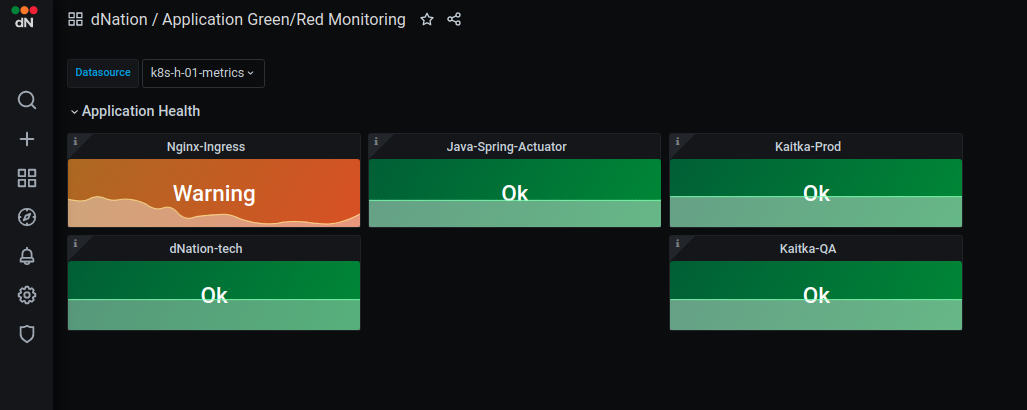
Applications (Java, Python, etc.)
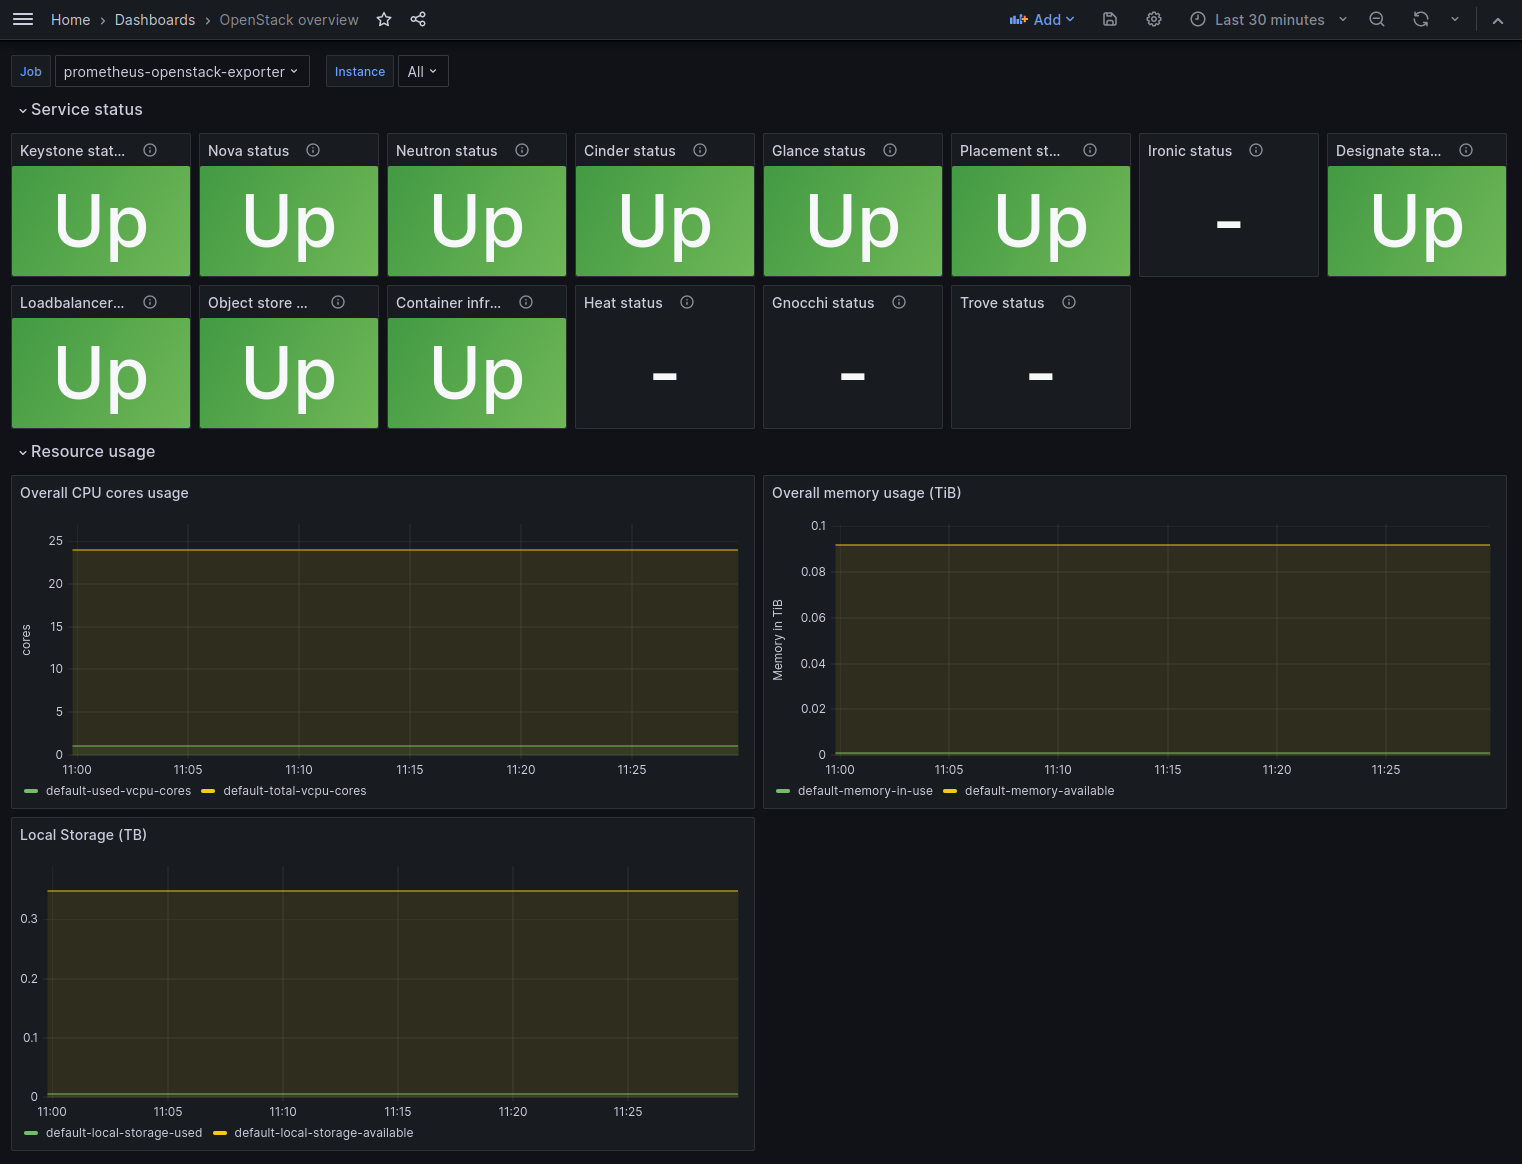
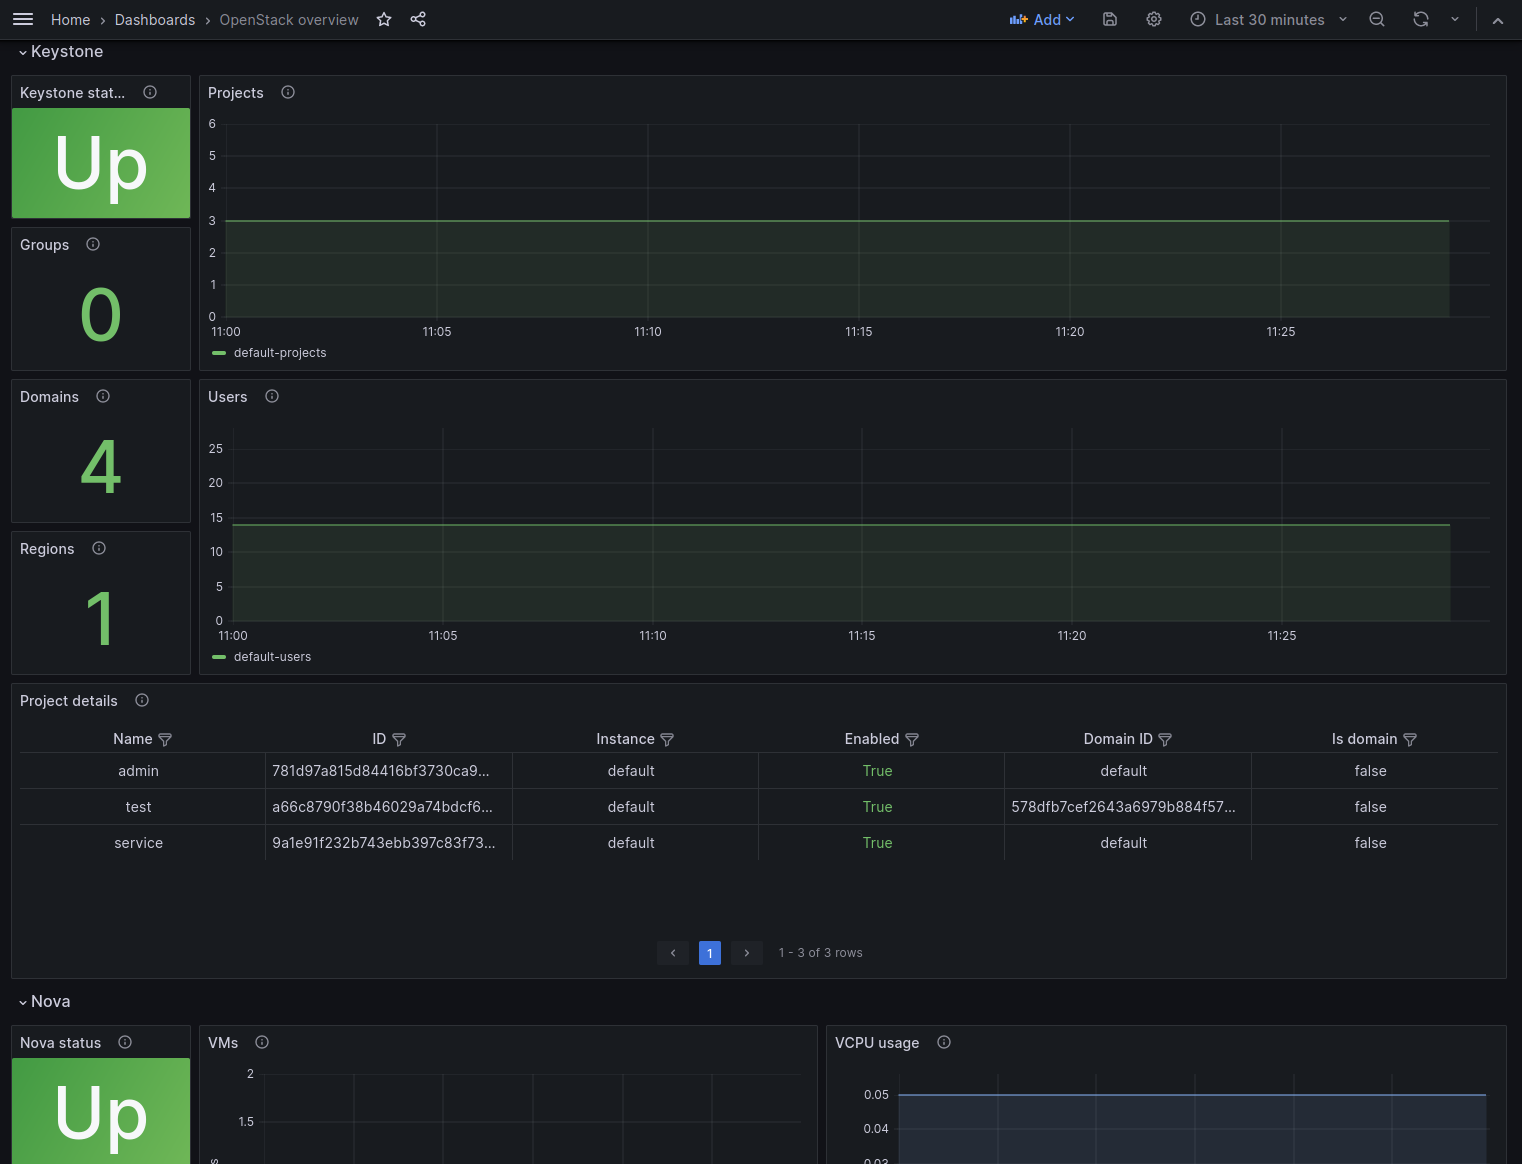
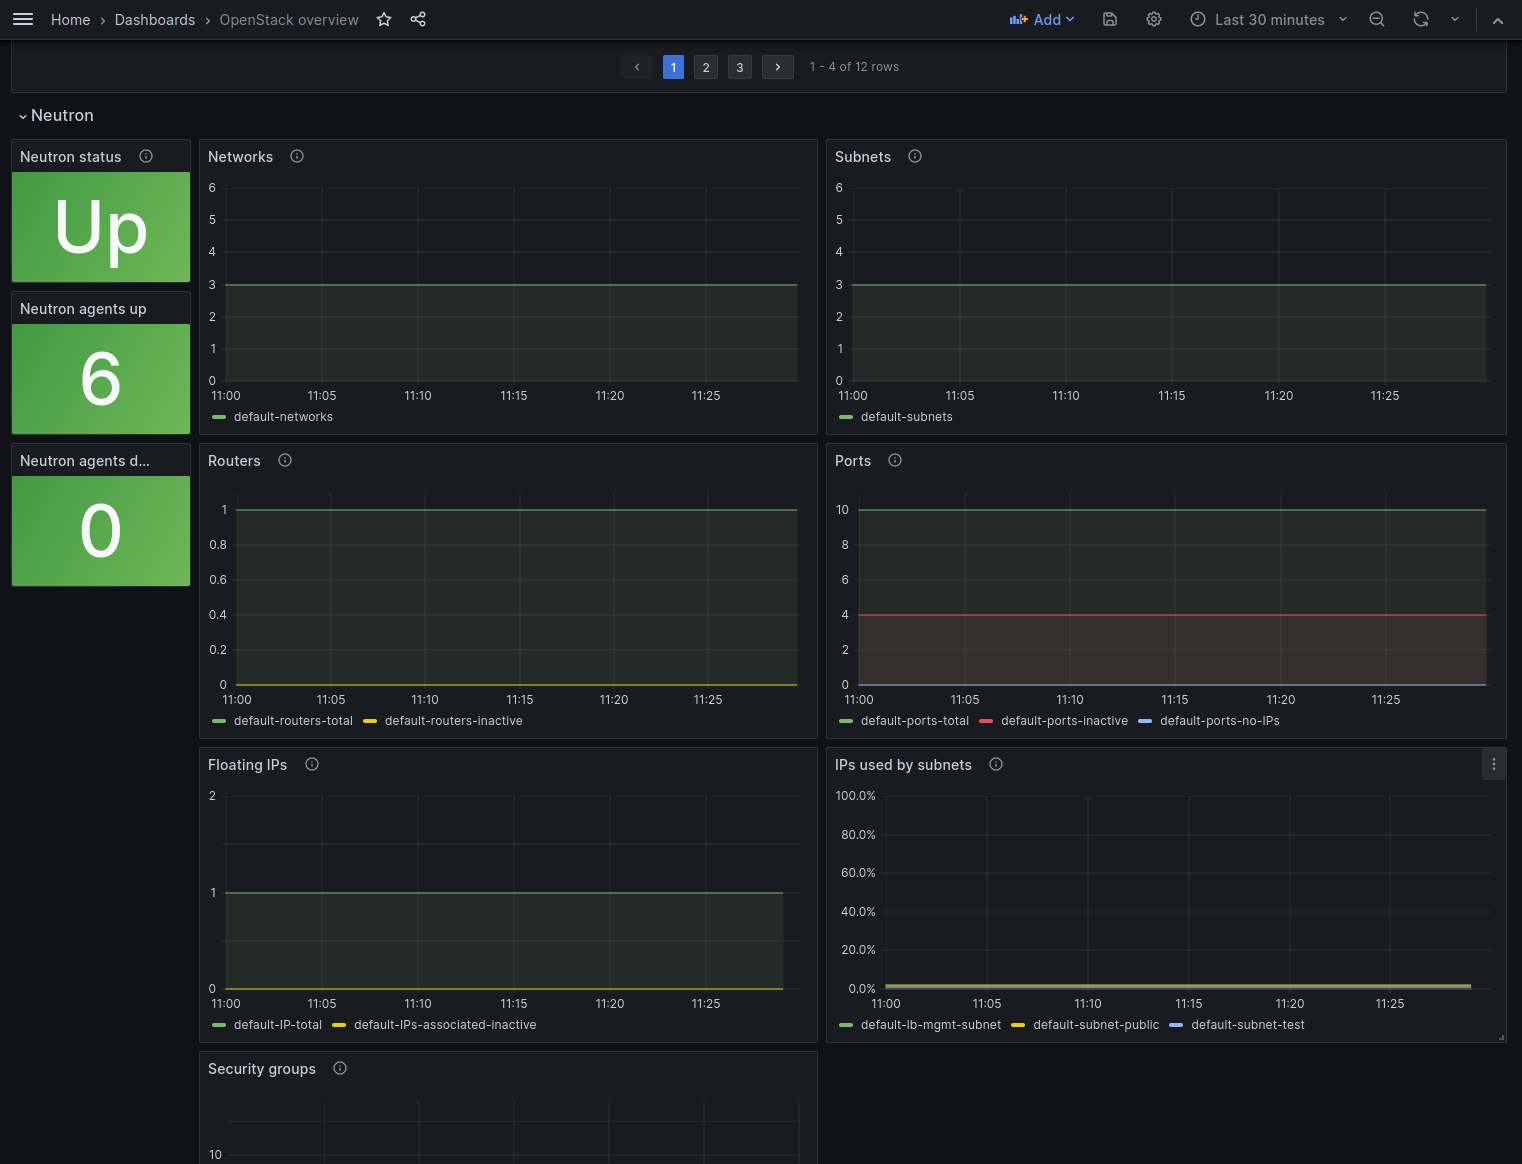
OpenStack platform
Basic use case
You received 17 alerts at 3 AM
You look at dashboard and see multiple problems, application A is in red, some PVCs are red, while k8s cluster itself is green; so you know where to start to look for root cause (non-green color)
You click PVC stat-panel, get a list of PVCs, all of them green, 1 of them red
It turns out that red PVC is used by application A
You fix PVC issue, and suddenly whole dashboard becomes green, so you have some indication that things are probably all right now
As a result, incident response time is improved
Commercial support
This project has been developed, maintained and used in production by professionals to simplify their day-to-day monitoring tasks and reduce incident reaction time.
Commercial support is available, including 24/7, please contact us.
We found about dNation Kubernetes Monitoring from your medium blog. We were facing the same issue with spending so much time on customizing dashboards. The dNation monitoring is really useful for us now and it immensely helps in debugging. Thanks to you and your team for this awesome tool.