
Introduction
Despite the popularity of Kubernetes, installing, operating, monitoring and troubleshooting a Kubernetes cluster is challenging. More often than not observability concepts are not sufficiently implemented, maintenance aspects are missing and systems are not optimized for production use.
We can map challenges above to Day 0 / Day 1 / Day 2 phases of the software life cycle. Day 0 is a design and proof of concept, Day 1 is installation and deployment and Day 2 is monitoring, maintenance and troubleshooting phase.
As of today we have passed Day 0 and Day 1 phases, so we are in Day 2 phase now.
In this post we will tell you what Day 2 challenges did we face during our Kubernetes migration, how we solved them and why we developed dNation Kubernetes Monitoring as an upper layer of our monitoring stack. We will also provide hands-on demonstration of how to set up the proposed monitoring solution for your Kubernetes cluster in minutes.
Managing Day 2 Kubernetes
Monitoring
Traditional monitoring tools (e.g. Nagios) and processes are not ideal for Kubernetes as they do not provide visibility into the dynamic container environment of distributed systems. Prometheus and Grafana are some of the most popular monitoring solutions for Kubernetes. These tools have graduated from the Cloud Native Computing Foundation (CNCF) which means that they are ready for production use and are the de-facto standard among open source monitoring solutions. They now come as the default option in most Kubernetes distributions such as Rancher or Openshift.
An easy way to set up and manage Prometheus is to use the Prometheus Operator by CoreOS. It uses Kubernetes custom resources to simplify deployment and configuration of Prometheus, Alertmanager, Grafana and related monitoring components.
There are several ways to install Prometheus Operator. We went through them and finally installed the kube-prometheus-stack helm chart. It is maintained by the Prometheus community and provides end-to-end Kubernetes cluster monitoring, collection of Grafana dashboards and Prometheus rules from kubernetes-mixin project.
As you can see, a single installation of kube-prometheus-stack deploys a lot of tools and software into your Kubernetes cluster. Thanks to the Prometheus community initial installation is easy and in addition the helm chart comes with several predefined Grafana dashboards that are a great start point.
We started to customize them right after installation. As we spent a serious amount of time customizing the dashboards on a daily basis, we finally realised that this approach will not work for us.
Logging
Kubernetes doesn’t specify a logging agent, but two optional logging agents are packaged with the Kubernetes release: Stackdriver Logging Agent (used for Google Cloud Platform) and Elasticsearch Logging Agent. Both use Fluentd with custom configuration as an agent on the node. There are also several third party logging solutions designed to operate in Kubernetes clusters (e.g. Logstash, Fluent Bit and others).
We tried and are still using the ELK stack (Elasticsearch, Logstash and Kibana) with Filebeat and Metricbeat data shippers for shipping log files and metrics into Elasticsearch. ELK stack meets our requirement to visualize metrics and logs but we also discovered its disadvantages. Namely significant CPU/RAM consumption, insufficient metrics information provided by default dashboards while their customizations are quite a time consuming task.
In the end we decided to give a chance to Grafana Loki – horizontally-scalable, highly-available, multi-tenant log aggregation system inspired by Prometheus. It is very lightweight, has native support in Grafana and it is possible to query logs in a way similar to Prometheus metrics. At that point we realized that there are currently not any open source solutions which offer suitable and production ready Grafana dashboards for Prometheus metrics and Loki logs side by side. At least we haven’t found them even after searching Google for quite a long time, however in case you know some, please let us know in discussion below.
That’s why we decided to develop dNation Kubernetes Monitoring – an upper layer for our monitoring stack.
Note that while Loki is much faster and also has significantly lower CPU/RAM footprint, Elasticsearch has more functionality which sometimes comes handy. Thus we use both logging solutions side-by-side, opting to Loki by default (because of its speed) and switching to Elasticsearch when needed (because of its rich functionality).
dNation Kubernetes Monitoring
Basic Principles
Our monitoring follows 3 basic principles which allow us to see up-to-date status of our Kubernetes infrastructure and applications at a glance:
- Intuitive – Green, orange and red colors signaling whether or not your action is needed
- Drill-down – if you want details why is something green, orange or red, just click it
- Relevant information only – provide only metrics relevant for this particular area of interest and drill-down level, side-by-side with logs
Architecture
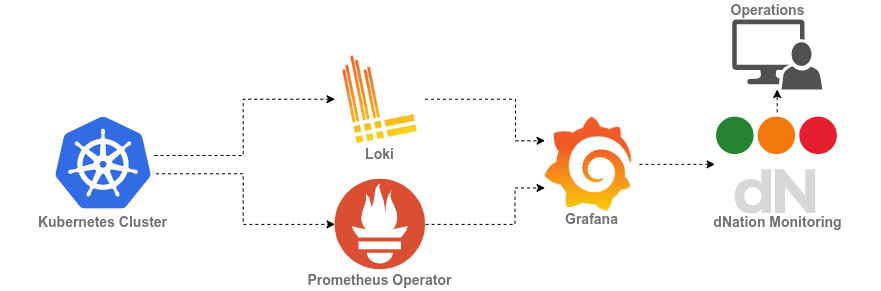
dNation Kubernetes Monitoring is an upper monitoring layer which operates on two underlying stacks:
- kube-prometheus-stack provides monitoring components: Prometheus, Alertmanager, Grafana, Node exporter and Kube state metrics
- loki-stack provides logging components: Loki and Promtail
Demo
Prerequisites
You will need following:
- A running Kubernetes cluster. We will use a simple KinD (Kubernetes in Docker) cluster in this demo, but monitoring works well on any Kubernetes setup
- Helm – a package manager for Kubernetes
- Kubectl – a Kubernetes command line tool (Monitoring installation does not require it but it will be used to perform some demo steps)
If your OS doesn’t contain packages above just apply following commands:
Install Kubectl
					curl -LO "https://dl.Kubernetes.io/release/$(curl -L -s https://dl.Kubernetes.io/release/stable.txt)/bin/linux/amd64/kubectl"
chmod +x ./kubectl
sudo mv ./kubectl /usr/bin/

kubectl version --client
Client Version: version.Info{Major:"1", Minor:"20", GitVersion:"v1.20.2"...
Install Helm
					curl -Lo ./helm.tar.gz https://get.helm.sh/helm-v3.2.4-linux-amd64.tar.gz
tar zxf helm.tar.gz
chmod +x ./linux-amd64/helm
sudo mv ./linux-amd64/helm /usr/bin/

helm version
version.BuildInfo{Version:"v3.2.4"...
Install KinD
					curl -Lo ./kind https://kind.sigs.Kubernetes.io/dl/v0.9.0/kind-linux-amd64
chmod +x ./kind
sudo mv ./kind /usr/bin/

kind version
kind v0.9.0 go1.15.2 linux/amd64
Prepare KinD cluster
Prepare a demo KinD cluster with a custom configuration file which contains a simple KinD cluster definition. Configuration includes definition of one master node, one worker node and kubeadm patches to expose Kubernetes control plane component metric endpoints in a Kubernetes cluster.
Create KinD cluster
					curl -LO https://raw.githubusercontent.com/dNationCloud/kubernetes-monitoring-stack/main/helpers/kind_cluster_config.yaml

kind create cluster --config kind_cluster_config.yaml --image kindest/node:v1.20.2
Creating cluster "kind" ...
Installation
For full Installation of dNation Kubernetes Monitoring we recommended to use umbrella helm chart which is both production ready and maintained as we use it in our own production environment.
Note: In case your current Kubernetes installation already contains Prometheus Operator, Grafana and Loki, it is also possible to install dNation Kubernetes Monitoring on top of an existing monitoring infrastructure.
As this is a fresh install, we need to define the public dNation chart repository in the helm configuration:
					helm repo add dnationcloud https://dnationcloud.github.io/helm-hub/
"dnationcloud" has been added to your repositories
It is a good practice to install new packages in a separate namespace, as it is easier to manage it this way. So we create a new namespace called monitoring:
					kubectl create namespace monitoring
namespace/monitoring created
Now we can install the dNation Kubernetes Monitoring Stack in the monitoring namespace:
helm install monitoring dnationcloud/dnation-kubernetes-monitoring-stack --namespace monitoring
Follow the installation notes and check if the helm has rolled out the monitoring correctly so installed PODs are up and running:
					kubectl --namespace monitoring get pods
NAME                                                     READY   STATUS    RESTARTS   AGE
alertmanager-kube-prometheus-alertmanager-0              2/2     Running   0          82s
dnation-kubernetes-jsonnet-translator-5f99896f7c-hddzl   1/1     Running   0          2m46s
kube-prometheus-operator-7dcb6b5d87-8kglq                1/1     Running   0          2m46s
monitoring-grafana-5bdbddf68d-8c7f9                      2/2     Running   0          2m46s
monitoring-kube-state-metrics-f7cf7ddd7-x7smd            1/1     Running   0          2m46s
monitoring-loki-0                                        1/1     Running   0          2m46s
monitoring-prometheus-node-exporter-4bf9x                1/1     Running   0          2m46s
monitoring-prometheus-node-exporter-xz9cz                1/1     Running   0          2m46s
monitoring-promtail-9mp9q                                1/1     Running   0          2m46s
monitoring-promtail-rp6w9                                1/1     Running   0          2m46s
prometheus-kube-prometheus-prometheus-0                  2/2     Running   1          82s
Congratulations! Now you are all set up and ready to explore.
Accessing dNation Kubernetes Monitoring
We will be using Kubernetes proxy to expose monitoring UI:
					export POD_NAME=$(kubectl get pods --namespace monitoring -l "app.kubernetes.io/name=grafana,app.kubernetes.io/instance=monitoring" -o jsonpath="{.items[0].metadata.name}")

kubectl --namespace monitoring port-forward $POD_NAME 3000
Forwarding from 127.0.0.1:3000 -> 3000
Forwarding from [::1]:3000 -> 3000
Let’s access dNation Kubernetes Monitoring at http://127.0.0.1:3000 and see what we get.
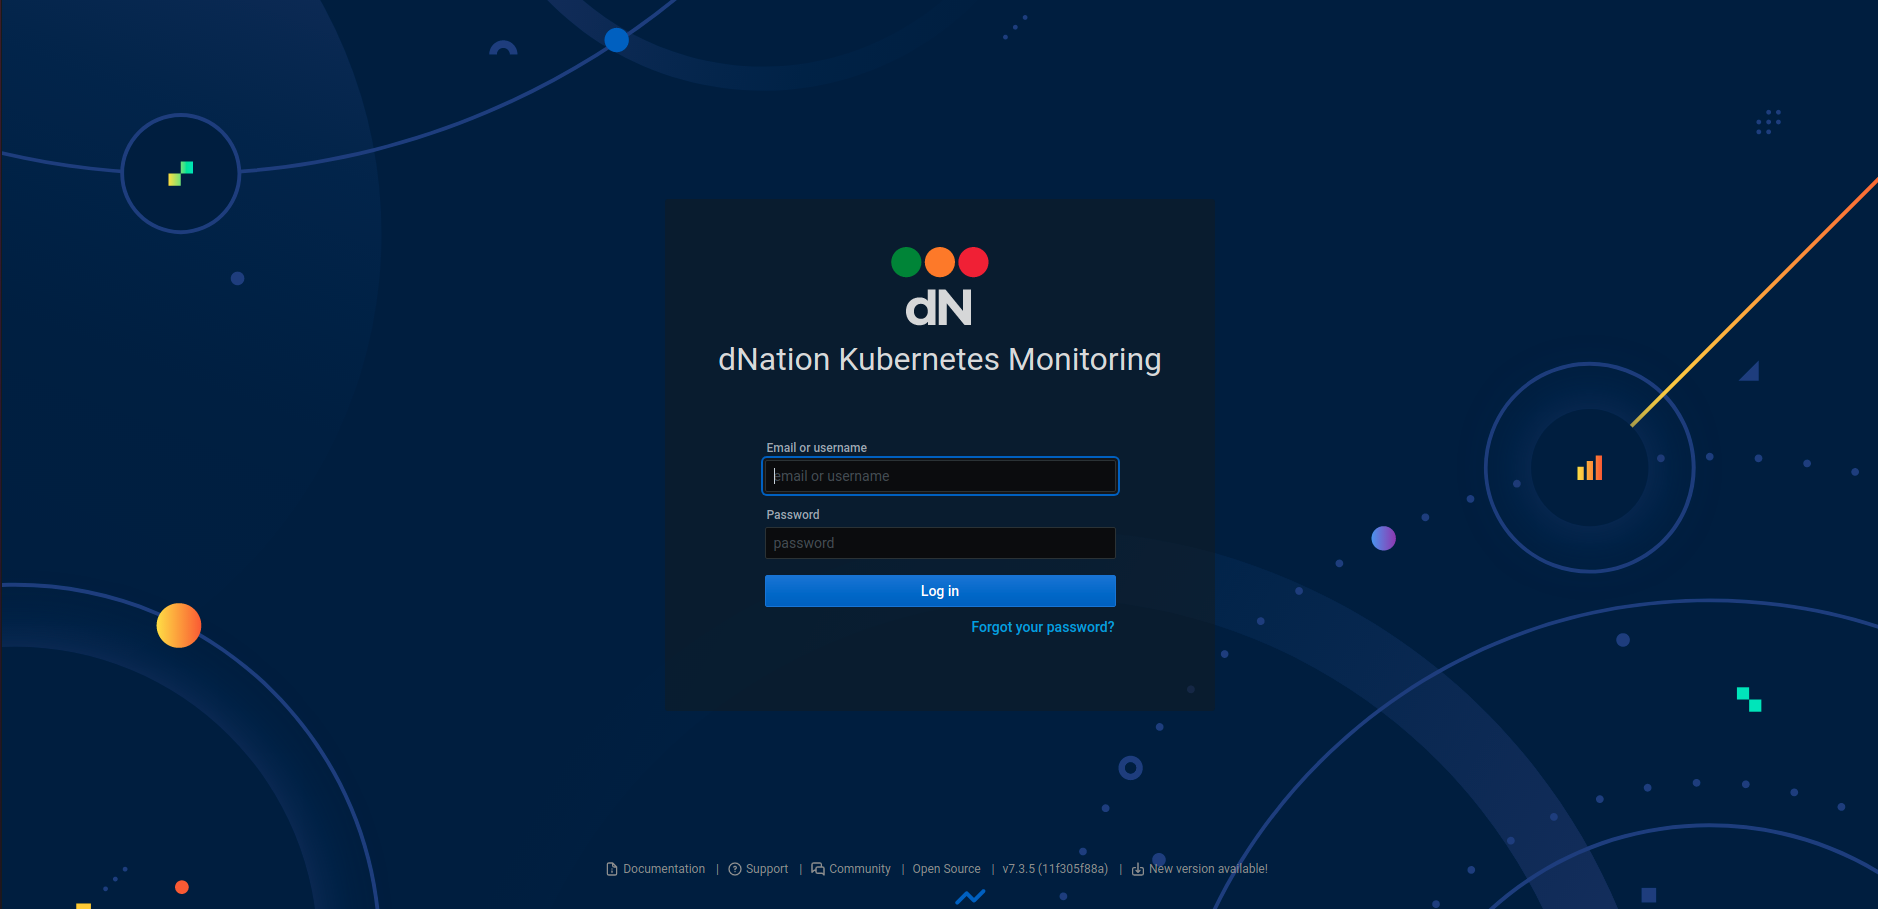
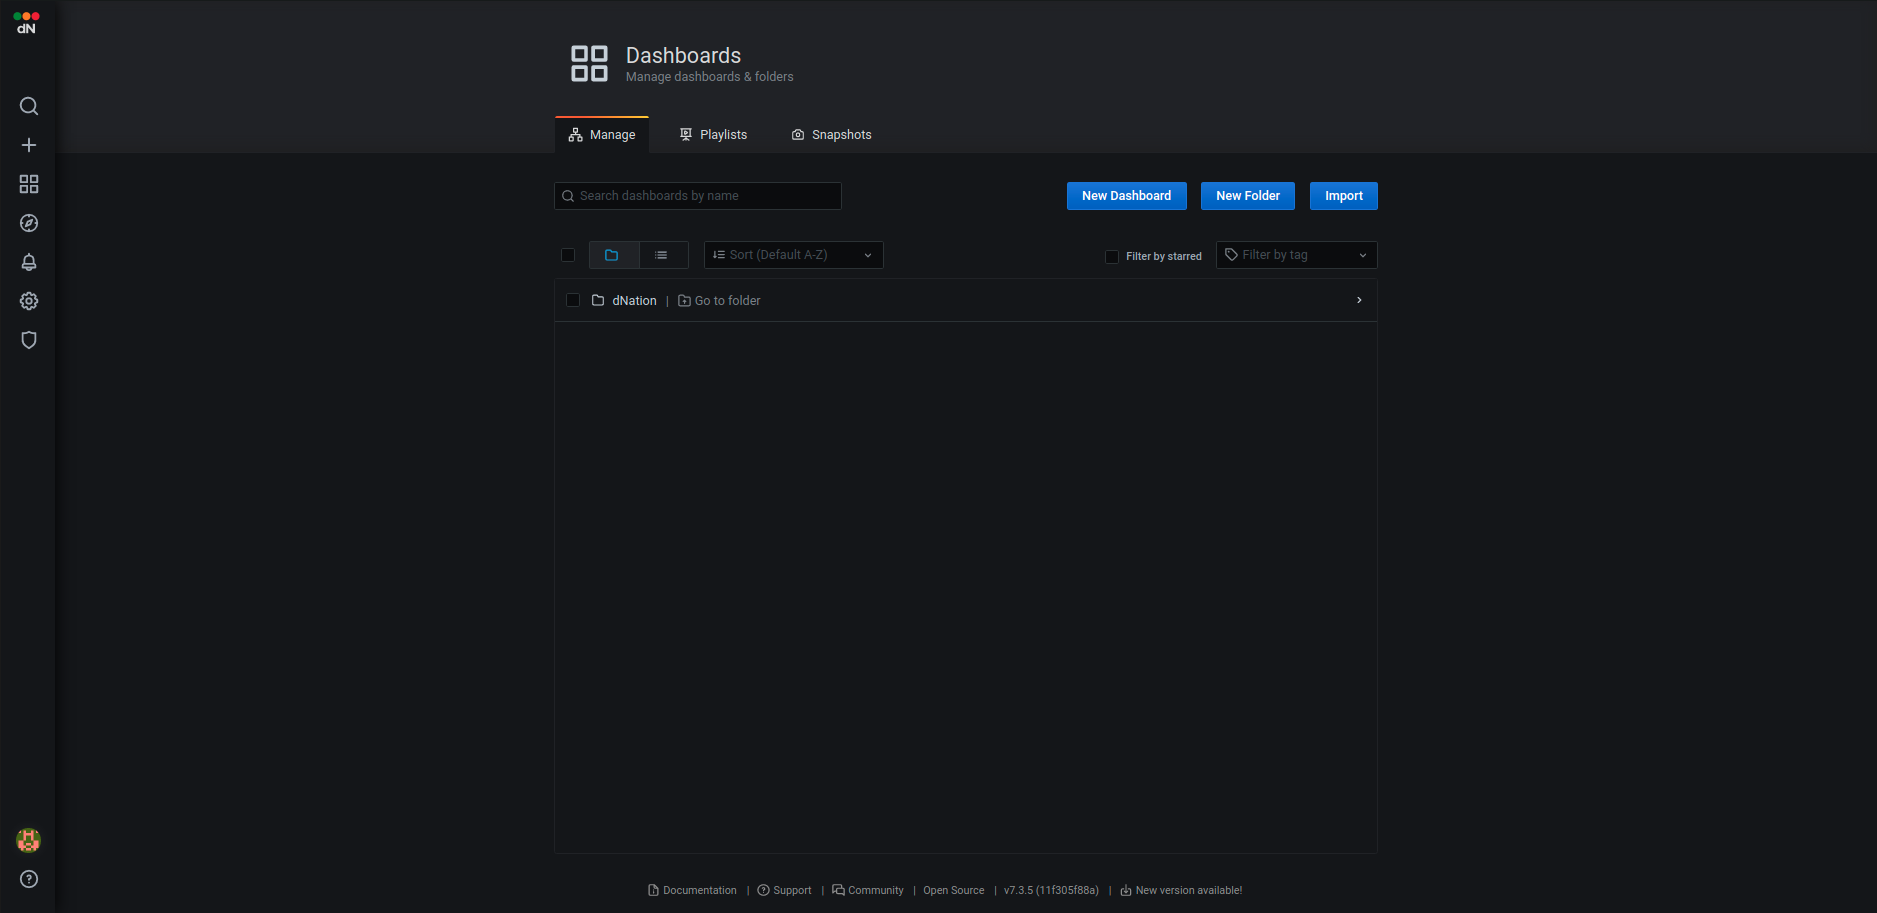
We need credentials to log into dNation Kubernetes Monitoring. The default username is admin and the default password is pass. Once logged in, you will get the default dashboard like the one below.
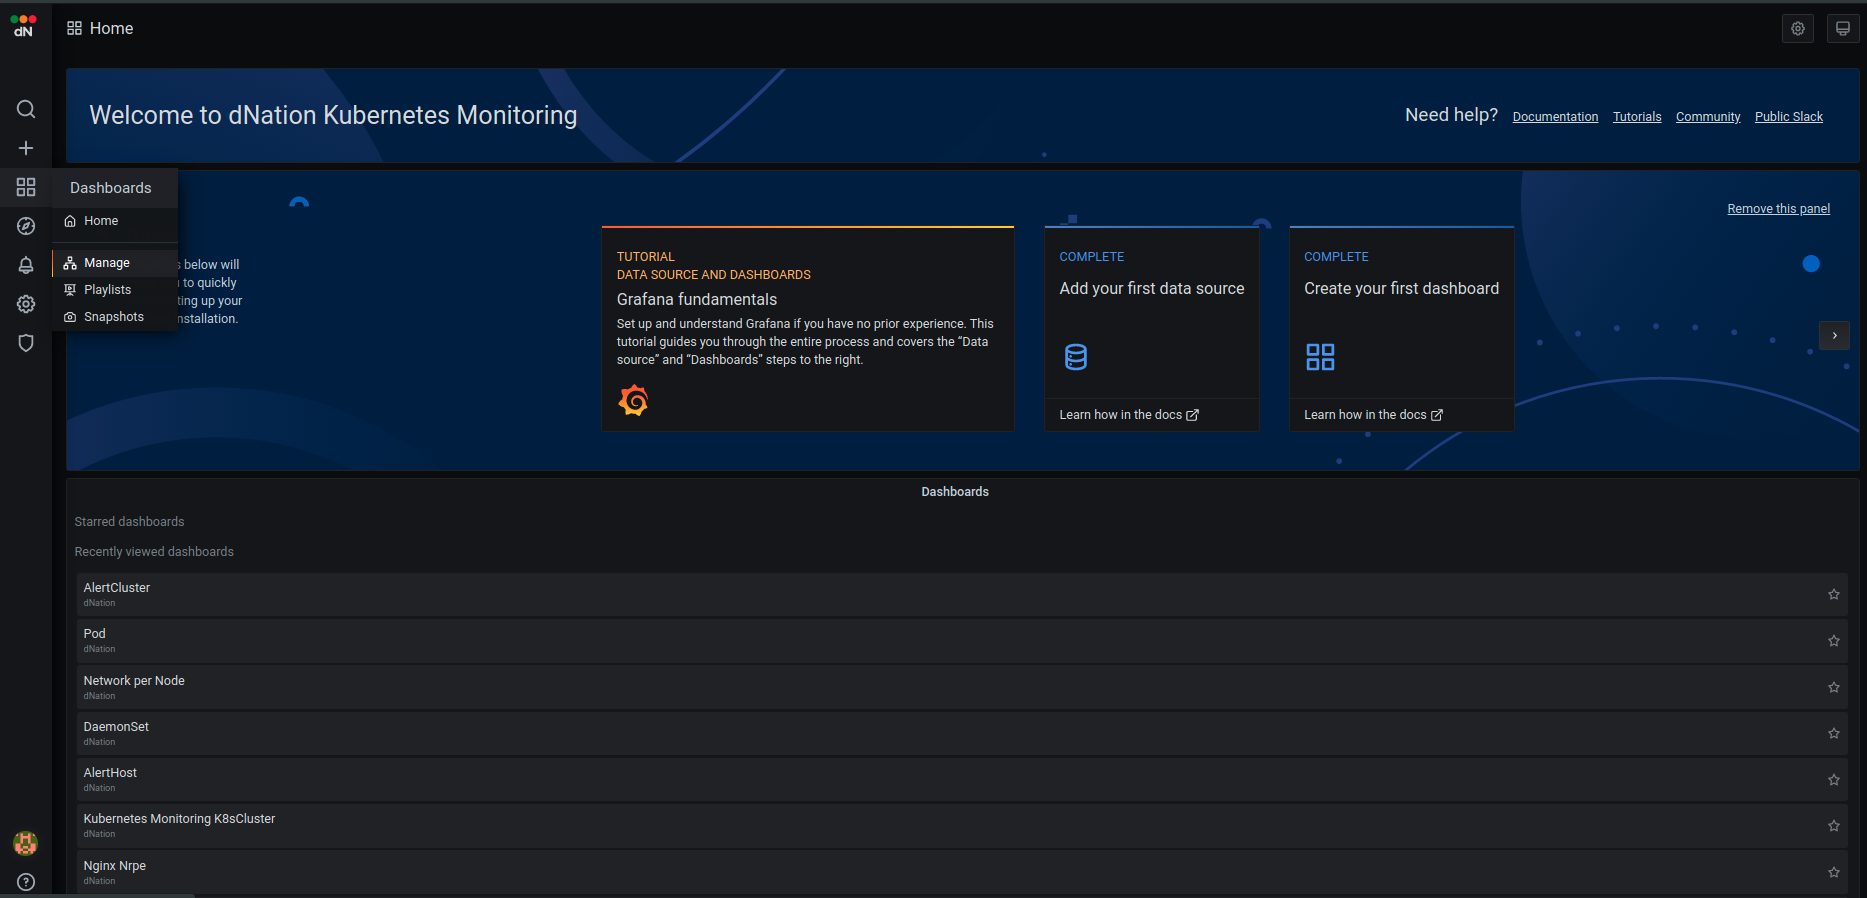
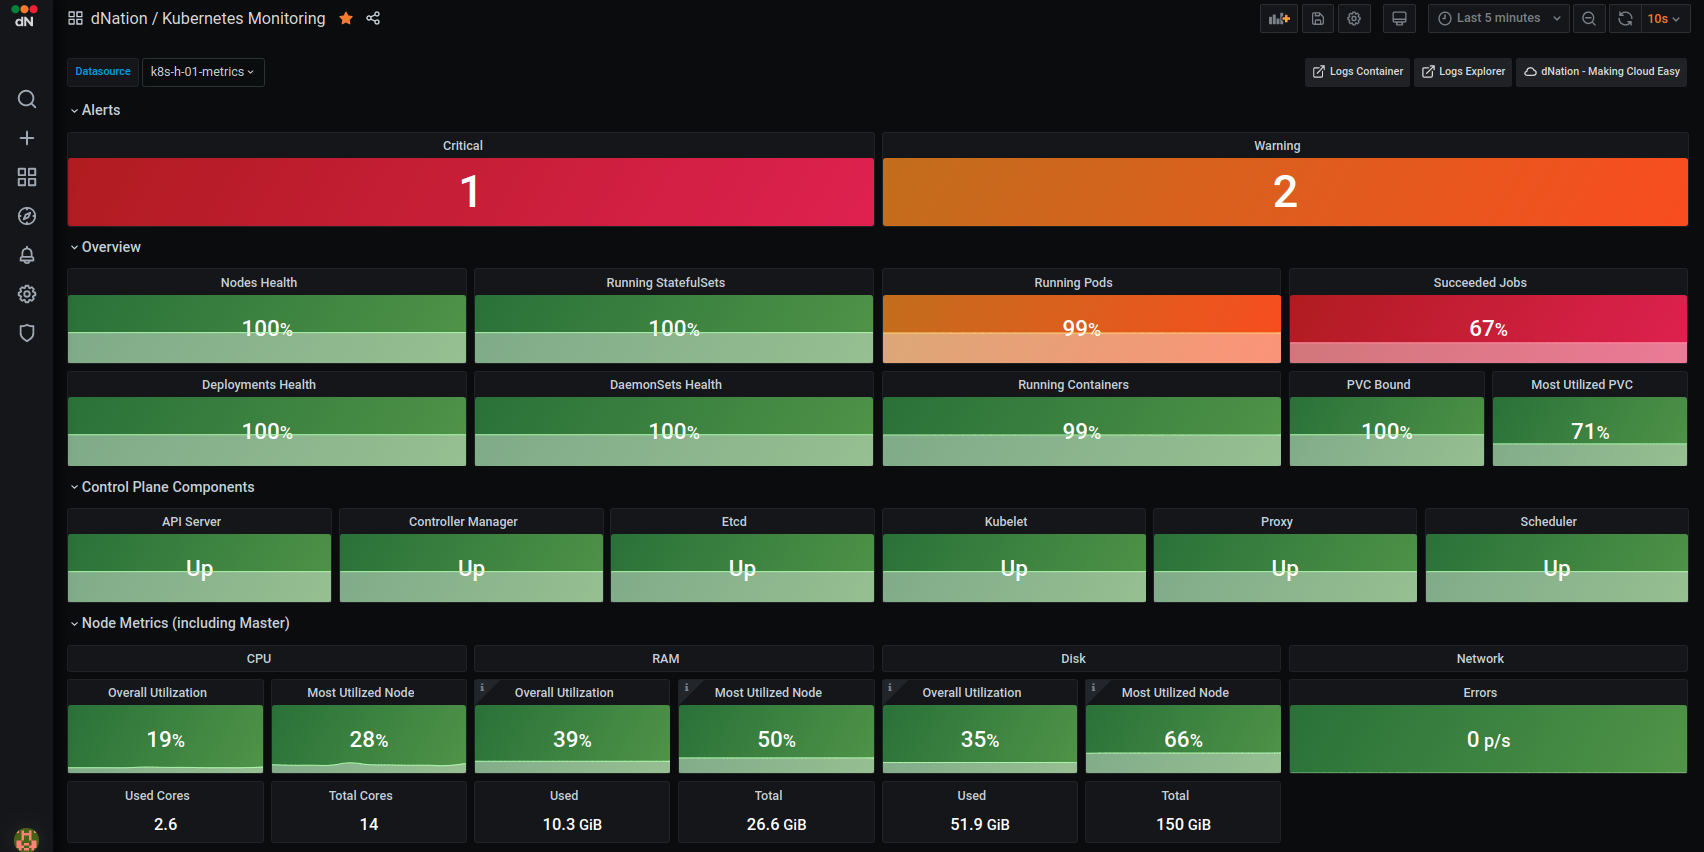
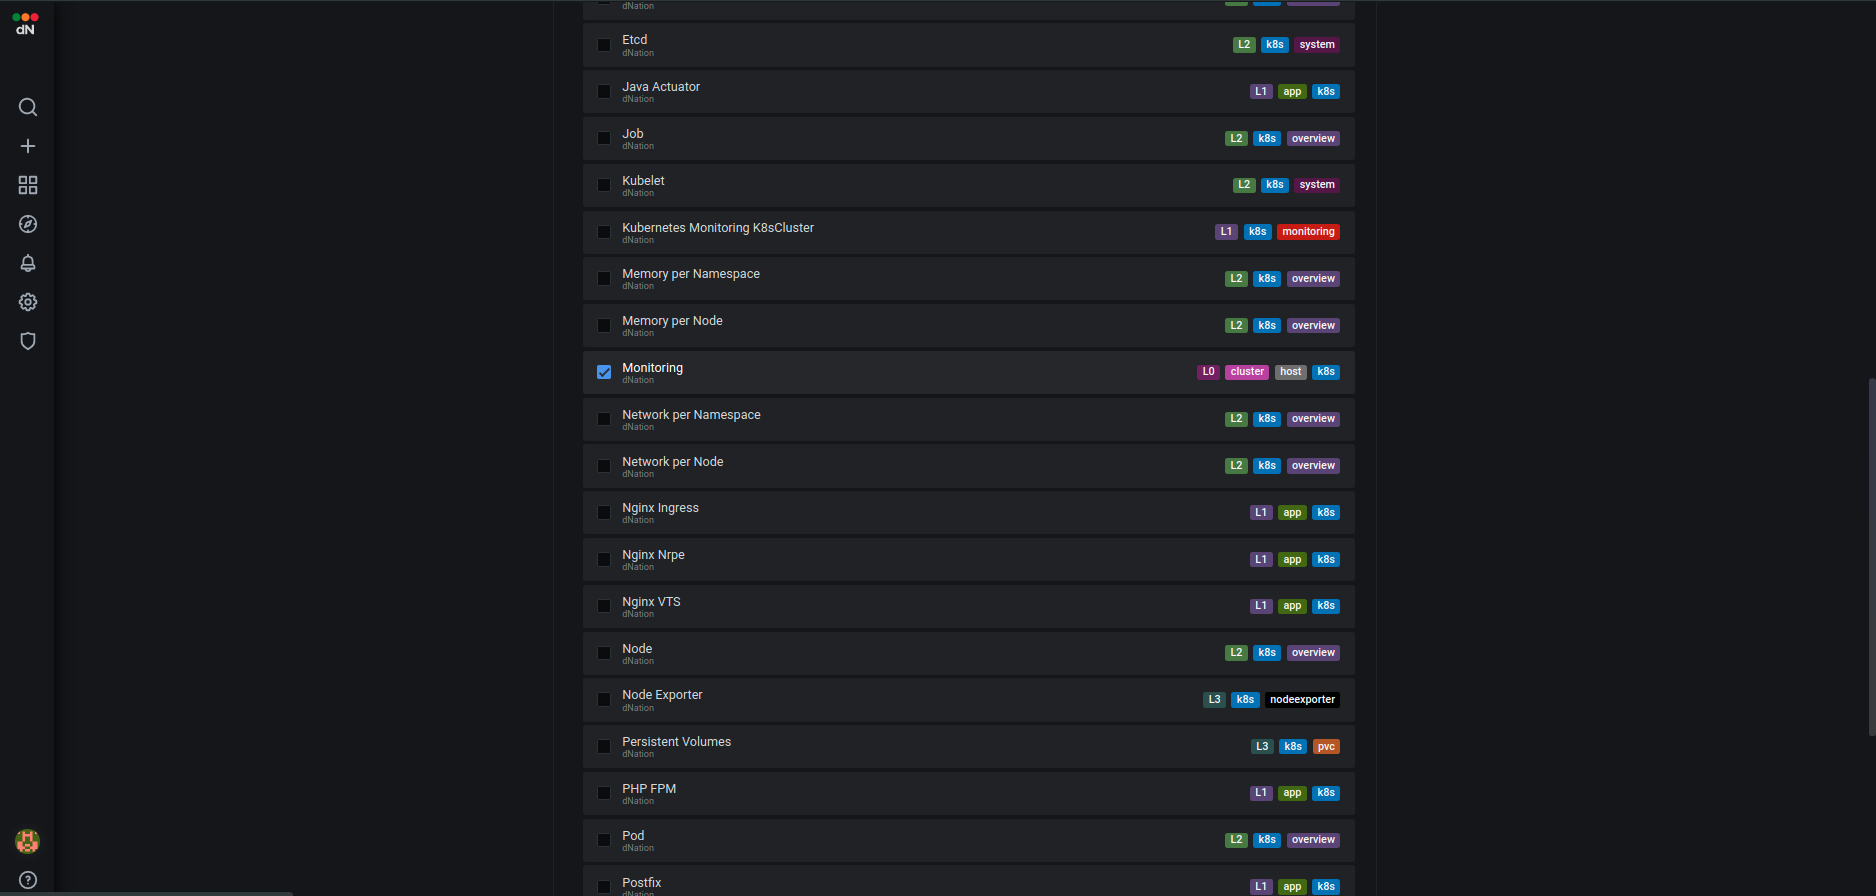
The dNation Kubernetes Monitoring comes with a lot of predefined dashboards. They are linked together in a layered way. Look for the Monitoring dashboard in the dNation directory.
Note: Our helm chart doesn’t set the Monitoring dashboard as a default one because it has an unfortunate side effect: ability to save dashboards is lost. However, you can follow these steps – setting it manually after installation preserves save ability.
Kubernetes cluster health is represented by a simple state panel which aggregates alerts from the underlying layer of Kubernetes monitoring. One state panel per cluster allows to easily see the health of multiple clusters at a glance (feature planned but not implemented yet).
Healthy status is represented by green color with an OK label. Orange with a Warning label is displayed in case of a warning alert and red with a Critical label in case of critical alert. We have implemented green, orange and red color indicators signalizing whether or not your action is needed.
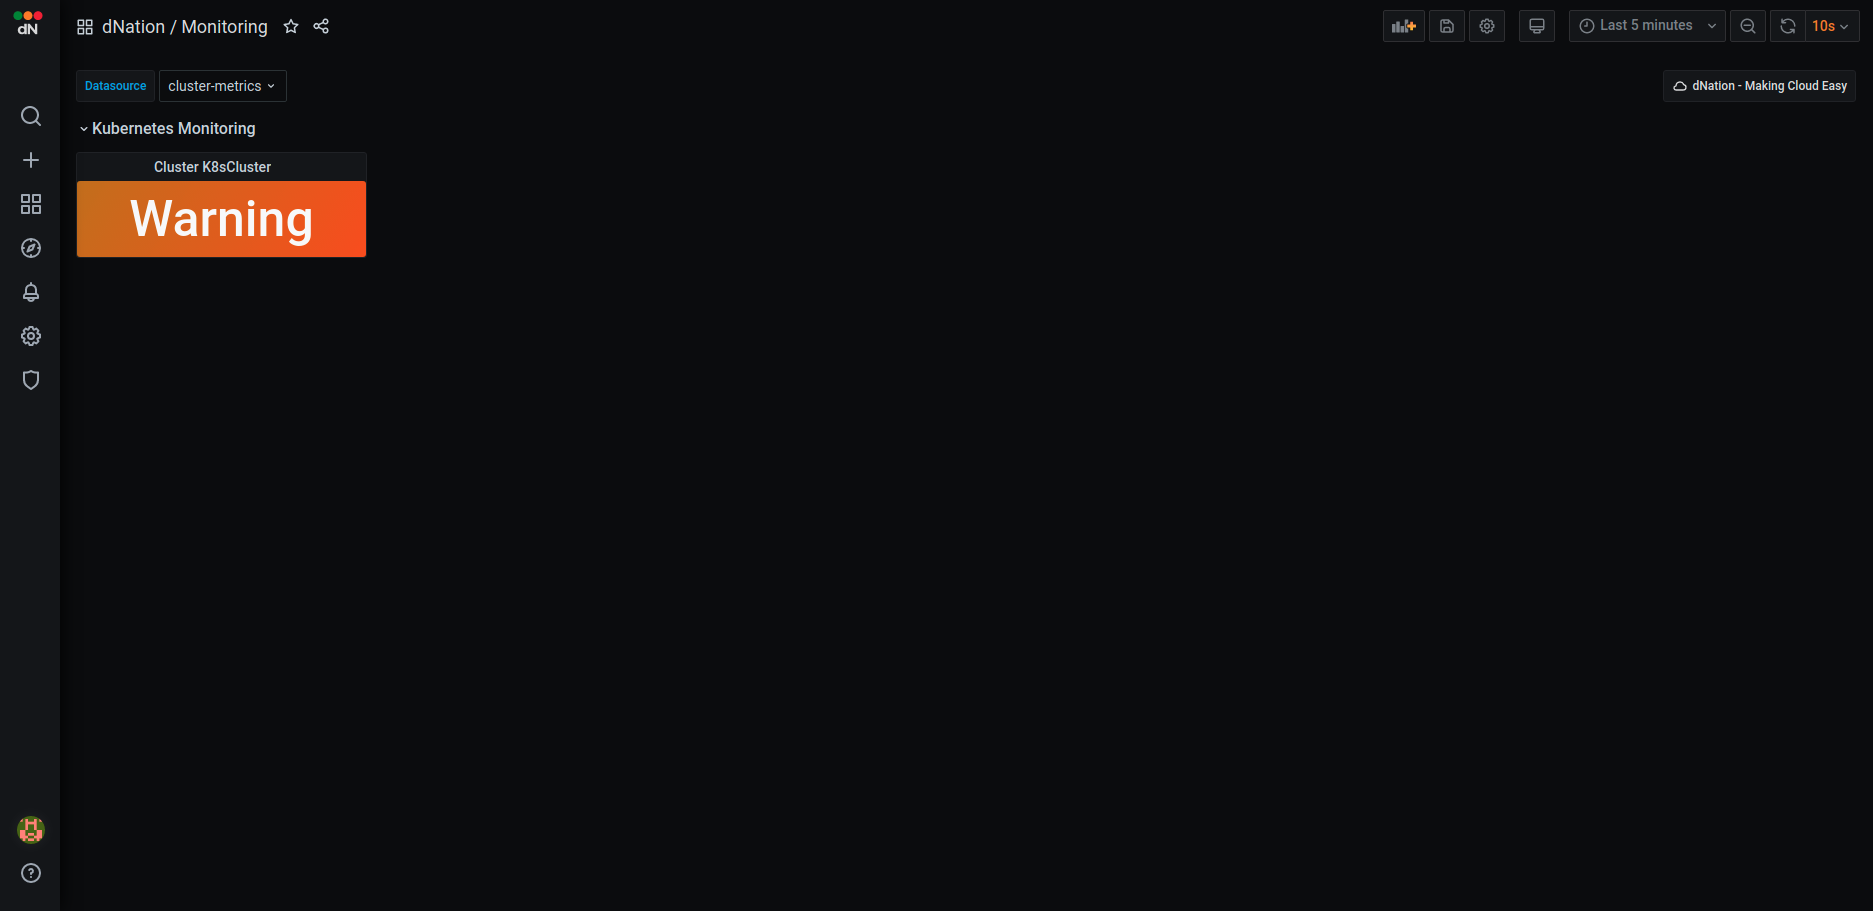
If you want to see more information about your cluster, just drill down by left-clicking on the state panel.
The first layer of Kubernetes monitoring consists of state panels that visualize the current state of a cluster. When a failed condition of a monitored Kubernetes element occurs then the state panel shows a lowered percentage value of health indicator. As you can see, some nodes in our demo deployment have RAM and disk issues (utilization is over the defined Warning threshold).
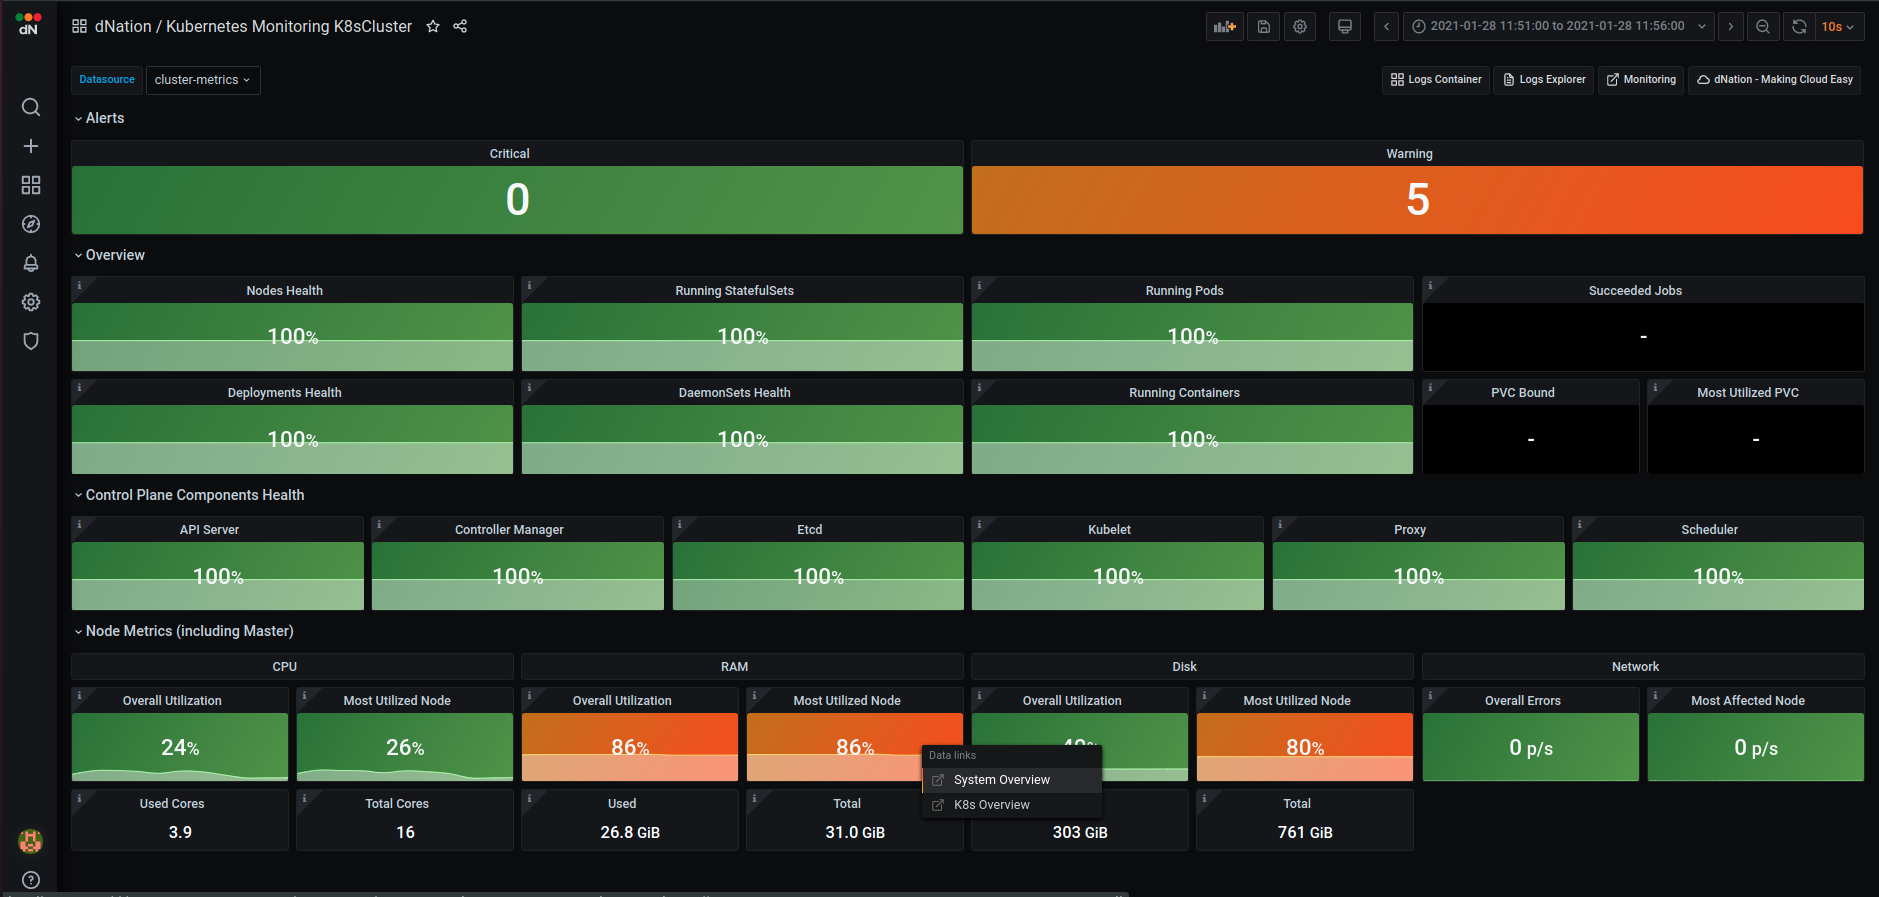
Let’s investigate which node in our cluster is under memory pressure and click on the “Most Utilized Node” state panel. You can select between System Overview or Kubernetes Overview buttons.
System Overview shows memory utilization per cluster node in detail. Kubernetes Overview shows system resource usage in a Kubernetes oriented manner, meaning that you can filter by a particular workload or see Kubernetes memory requests and limits.
Let’s choose the System Overview option.
Note: Demo KinD Kubernetes cluster is deployed on a single host, therefore you see the same memory utilization on both master and worker nodes.

For further investigation just drill down (left click the affected node) and access layer 3 Node Exporter dashboard where you can investigate node health in more details.

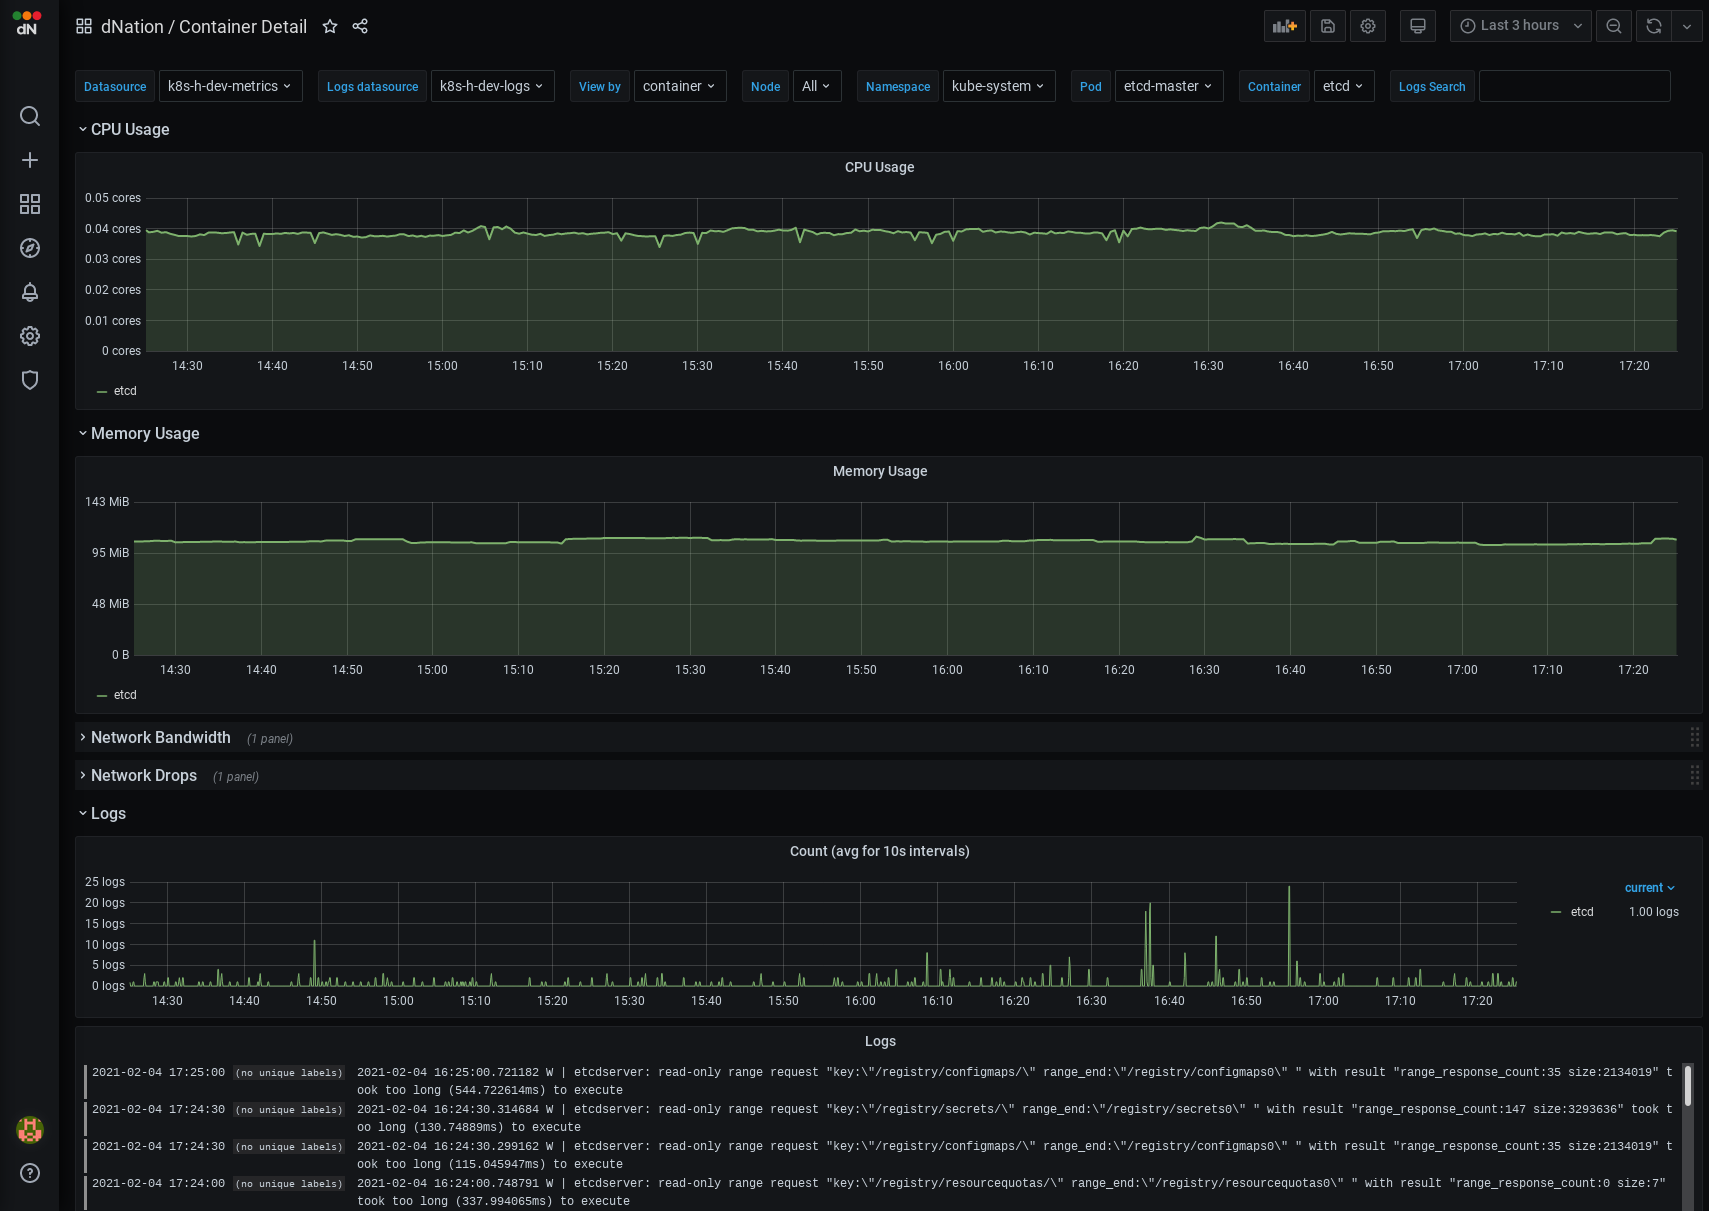
If you are interested whether some particular container works expected, just access the Running containers stats panel on the layer 1 of monitoring. The Container layer 2 dashboard provides a quick overview of containers health.

Left click on particular container (e.g. etcd) and see relevant metrics information side-by-side with logs.
Conclusion
You can discover a lot of other dashboards that give you valuable insights about the health of your cluster. You can also discover features like Host Monitoring which allows you to monitor your hosts (physical or VM) or Application Monitoring which allows you to thoroughly understand your application health (e.g. Ingress Controller specific metrics, etc.).
Happy monitoring!